Back
18 Feb 2020
USD/JPY Price Analysis: Dollar eases from session highs vs. yen, trades sub-110.00 level
- USD/JPY sideways theme remains intact in the first half of the week.
- The rising wedge pattern can limit bullish advances.
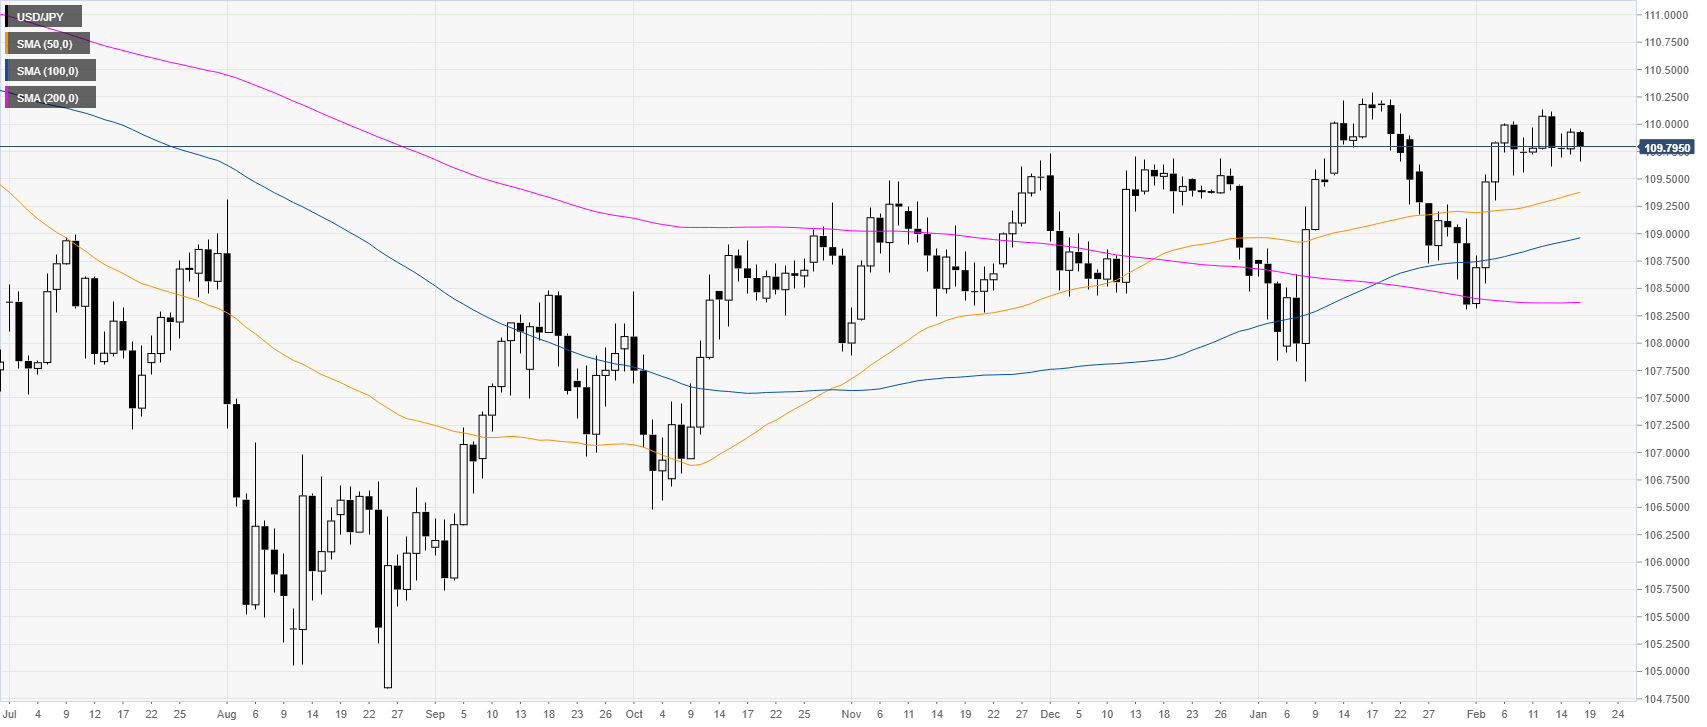
USD/JPY daily chart
USD/JPY is extending the ranging theme for the 10th consecutive day as the spot is trading off February highs and below the 110.00 figure. The quote is trading above the main daily simple moving averages (SMAs) on the daily time frame.
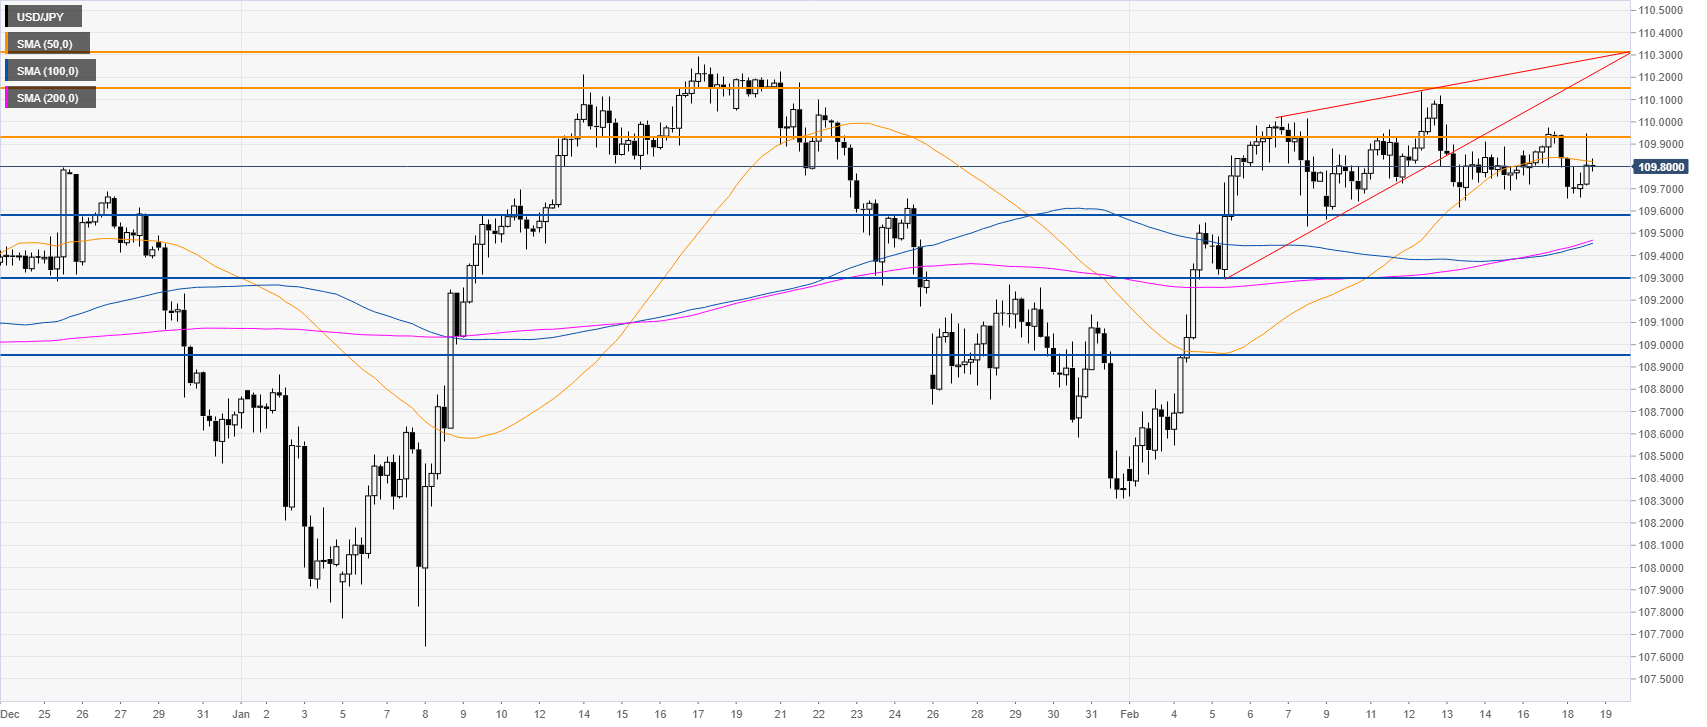
USD/JPY four-hour chart
USD/JPY broke below a rising wedge formation while above the 100/200 SMAs. The quote is trading sideways below the 109.94 resistance and the 50 SMA on the four-hour chart. Bears are probably looking for a break below the 109.58 support and to drive the market towards 109.30 and 108.95 price levels. On the flip side, a daily close above the 110.15 resistance might invalidate the bearish scenario, according to the Technical Confluences Indicator.
Resistance: 109.94, 110.15, 110.32
Support: 109.58, 109.30, 108.95
Additional key levels