Confirming you are not from the U.S. or the Philippines

यह बयान देते हुए मैं स्पष्ट रूप से घोषणा और पुष्टि करता/करती हूँ कि:
  • मैं U.S. का/की नागरिक या निवासी नहीं हूँ
  • मैं फिलीपींस का निवासी नहीं हूं
  • मेरे पास सीधे या परोक्ष रूप में U.S. निवासियों के 10% से अधिक शेयर/मतदान अधिकार/हित नहीं हैं और/या मैं अन्य माध्यमों से U.S. नागरिकों या निवासियों को नियंत्रित नहीं करता/करती हूँ
  • मैं 10% से अधिक शेयरों/मतदान अधिकारों/हितों का सीधे या परोक्ष रूप से स्वामित्व नहीं रखता और/या अन्य माध्यमों से U.S. नागरिक या निवासी के नियंत्रण में नहीं हूँ
  • मैं FATCA की धारा 1504(a) के अनुसार U.S. नागरिकों या निवासियों से संबद्ध नहीं हूँ
  • मैं गलत घोषणा करने के अपने उत्तरदायित्व से अवगत हूँ।
इस बयान के प्रयोजनों के लिए, सभी U.S. आश्रित देश और क्षेत्र संयुक्त राज्य अमेरिका के मुख्य क्षेत्र के समान हैं। मैं ऑक्टा मार्केट्स इनकॉर्पोरेटेड, इसके निदेशकों और अधिकारियों को अपने बयान के किसी भी उल्लंघन से उत्पन्न होने वाले या उससे संबंधित किसी भी दावे के खिलाफ बचाव के लिए प्रतिबद्ध हूँ।
हम आपकी गोपनीयता और आपकी व्यक्तिगत जानकारी की सुरक्षा के लिए समर्पित हैं। हम केवल अपने उत्पादों और सेवाओं के बारे में विशेष पेशकश और महत्वपूर्ण जानकारी प्रदान करने के लिए ईमेल एकत्र करते हैं। अपना ईमेल पता सबमिट करके, आप हमसे ऐसे पत्र प्राप्त करने के लिए सहमत होते हैं। अगर आप सदस्यता समाप्त करना चाहते हैं या आपके पास कोई प्रश्न या चिंता है, तो हमारे ग्राहक सेवा केंद्र को लिखें।
    Octa trading broker
      ट्रेडिंग अकाउंट खोले
      Back

      GBP/USD Price Analysis: Climbs towards 1.2800 as technicals suggest a pullback

      • GBP/USD registers solid gains on Monday on thin volume.
      • From a daily chart perspective, the major could challenge the YTD high and 1.2900.
      • Short-term, as RSI is overbought, look for a pullback to 1.2750 and 1.2700.

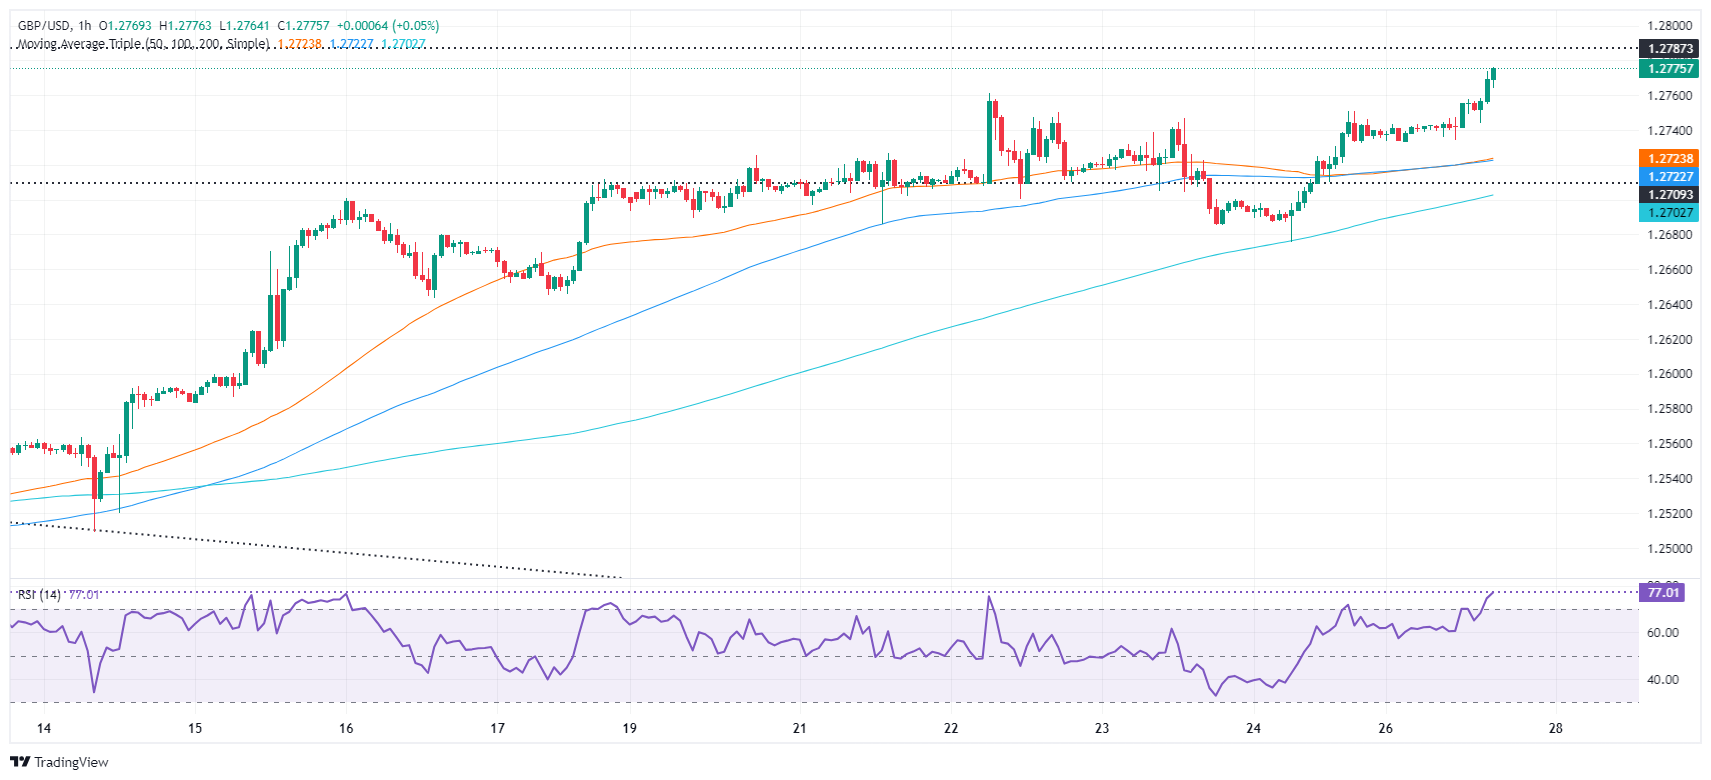
      The Pound Sterling climbed 0.30% against the Greenback on Monday amid thin liquidity conditions in observance of UK and US holidays. At the time of writing, the GBP/USD trades at 1.2772 after hitting a daily low of 1.2728.

      GBP/USD Price Analysis: Technical outlook

      The GBP/USD daily chart depicts the pair as upward biased, aimed to challenge the March 21 cycle high at 1.2803. If cleared on further strength, up next lies the year-to-date (YTD) high at 1.2894. Failure to do it, and sellers could keep the pair within the 1.2700 – 1.2800 range ahead of the release of the US Core Personal Consumer Expenditures Price Index (PCE) on Friday.

      Shor-term, the GBP/USD has broken the latest cycle peak at 1.2761, exposing the resistance levels. Despite that, caution is warranted as momentum suggests that buying pressure could be fading as the Relative Strength Index (RSI) shifted overbought. In that event, sellers could step in once the RSI pierces below 70.

      If the GBP/USD retreats below 1.2750, the next stop would be the current day’s low of 1.2728. Once cleared, the next stop would be the 1.2700 mark.

      GBP/USD Price Action – Hourly Chart

      GBP/USD

      Overview
      Today last price 1.2776
      Today Daily Change 0.0038
      Today Daily Change % 0.30
      Today daily open 1.2738
       
      Trends
      Daily SMA20 1.2603
      Daily SMA50 1.2581
      Daily SMA100 1.2633
      Daily SMA200 1.2541
       
      Levels
      Previous Daily High 1.2751
      Previous Daily Low 1.2676
      Previous Weekly High 1.2761
      Previous Weekly Low 1.2676
      Previous Monthly High 1.2709
      Previous Monthly Low 1.23
      Daily Fibonacci 38.2% 1.2722
      Daily Fibonacci 61.8% 1.2705
      Daily Pivot Point S1 1.2692
      Daily Pivot Point S2 1.2646
      Daily Pivot Point S3 1.2617
      Daily Pivot Point R1 1.2767
      Daily Pivot Point R2 1.2797
      Daily Pivot Point R3 1.2842


      British Pound PRICE Today

      The table below shows the percentage change of British Pound (GBP) against listed major currencies today. British Pound was the strongest against the US Dollar.

        USD EUR GBP JPY CAD AUD NZD CHF
      USD   -0.09% -0.30% -0.13% -0.24% -0.44% -0.56% -0.07%
      EUR 0.09%   -0.23% -0.02% -0.15% -0.41% -0.56% 0.05%
      GBP 0.30% 0.23%   0.16% 0.05% -0.17% -0.27% 0.25%
      JPY 0.13% 0.02% -0.16%   -0.16% -0.34% -0.37% 0.02%
      CAD 0.24% 0.15% -0.05% 0.16%   -0.22% -0.32% 0.11%
      AUD 0.44% 0.41% 0.17% 0.34% 0.22%   -0.07% 0.42%
      NZD 0.56% 0.56% 0.27% 0.37% 0.32% 0.07%   0.48%
      CHF 0.07% -0.05% -0.25% -0.02% -0.11% -0.42% -0.48%  

      The heat map shows percentage changes of major currencies against each other. The base currency is picked from the left column, while the quote currency is picked from the top row. For example, if you pick the British Pound from the left column and move along the horizontal line to the US Dollar, the percentage change displayed in the box will represent GBP (base)/USD (quote).


      WTI extends recovery to $78.50 ahead of global inflation data, OPEC meet

      West Texas Intermediate (WTI), futures on NYMEX, rises further to $78.50 in Monday’s New York session.
      अधिक पढ़ें Previous

      US Dollar in downtrend on quiet Monday, markets eye GDP, PCE data

      The US Dollar Index (DXY) is seeing some losses on Monday as US markets remain closed for the Memorial Day break.
      अधिक पढ़ें Next